 Sean Harding/blog
I finally was able to get my hands on an iPhone 3G (black 16GB, at Bellevue Square). But I’ve continued to be kind of fascinated by the whole issue of availability. Finding an iPhone is still not easy in many parts of the country! I’ve been gathering some data from Apple’s availabilty checker (which I disparaged in my last post). It isn’t 100% accurate, but it appears to be better than I originally thought.
The trick is that it seems to be showing current availability, even though the page is worded to make it sound like it’s showing the next day’s availability. So after the Apple Store has closed for the day, the only way that page is going to show phones as available is if they had some left over at the end of the day. If they’re getting more the next morning (as many stores have been), it won’t be reflected on that page. Of course, the page also doesn’t tell us how many phones are in stock — if it’s only one, you’re not going to have much luck getting it.
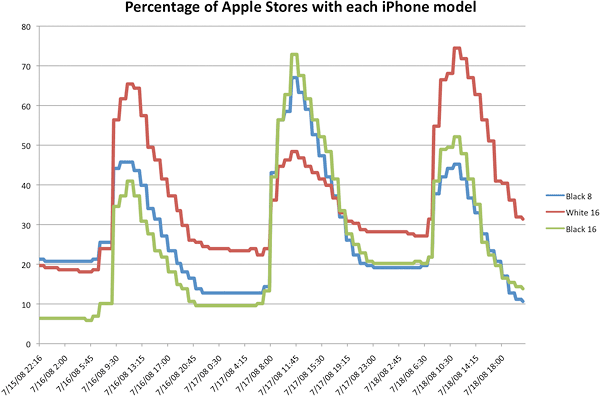
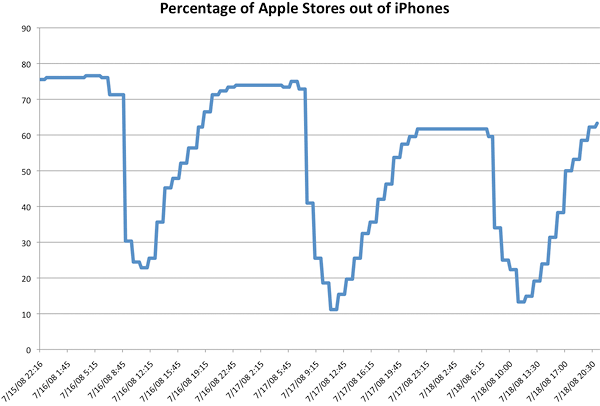
Anyway, I started collecting the data that the availability checker page shows a couple of days ago. If you can look beyond my embarrassingly bad Excel charting skills, these may be interesting (yes, I should be using Google Charts, but I wasn’t feeling patient enough to figure out how to make it do what I want, and gnuplot gives me a headache every time I use it). You’ll notice that stock goes down over the course of the day (i.e. stores run out of stock), then it spikes back up again in the morning.


Charts updated July 18 at 9:15PM PDT, the rest of this post reflects data as of the evening of July 17.
A few other interesting tidbits:
If I have time, I’ll run these queries again next week when I have more data. Of course, this should all be taken with a grain of salt, since it’s only as accurate as the data Apple publishes on their availability web page. But it’s better than nothing.